Interactive dashboards that turn complex data into clear, actionable insights — built for every industry, tailored to your needs.
Transform Data into Decisions
Interactive dashboards that turn complex data into clear, actionable insights — built for every industry, tailored to your needs.
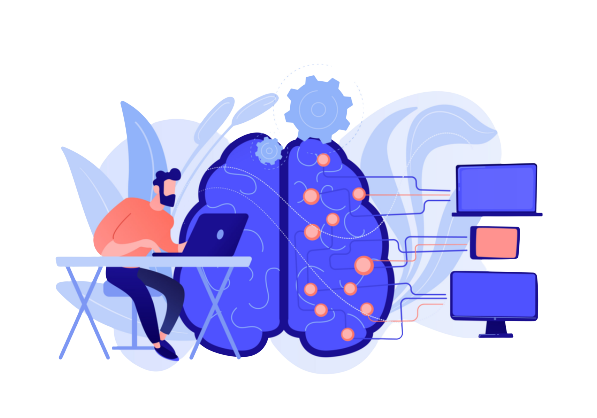
Knowledge Graph
We created a Knowledge Graph for our client where it enables the user to search for studies that are related to relevant compounds, organs and cell types
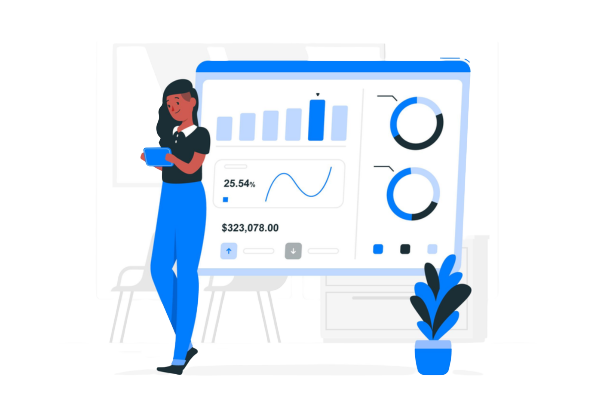
Client needed to understand the cause of increased attrition in his company.
So we built him a real-time dashboard to help track his employees reviews and respective sentiment. This helped him reveal the root cause of attrition and fix it.
We created a Knowledge Graph for our client where it enables the user to search for studies that are related to relevant compounds, organs and cell types
Client needed to understand the cause of increased attrition in his company.
So we built him a real-time dashboard to help track his employees reviews and respective sentiment. This helped him reveal the root cause of attrition and fix it.
We developed a real-time dashboard to track employee reviews and sentiment, providing valuable insights that helped uncover and address the root cause of attrition effectively.